
I built an data processing pipeline in Python that transforms 9 relational datasets (100K+ orders) into three analytics-ready base tables with 40+ engineered features for business intelligence.

Motivation
Real-world e-commerce data is rarely analysis-ready and often lacks key features needed for modeling tasks such as pricing optimization, churn prediction, or logistics improvement. A critical step is transforming raw, fragmented transactional tables into clean analytical datasets. In this project, I used a publicly available Brazilian marketplace dataset (2016–2018) to demonstrate this process.
Raw datasets
The initial 9 relational datasets are presented via an Entity Relationship Diagram (ERD), defining the cardinality and mapping the relationships between entities.
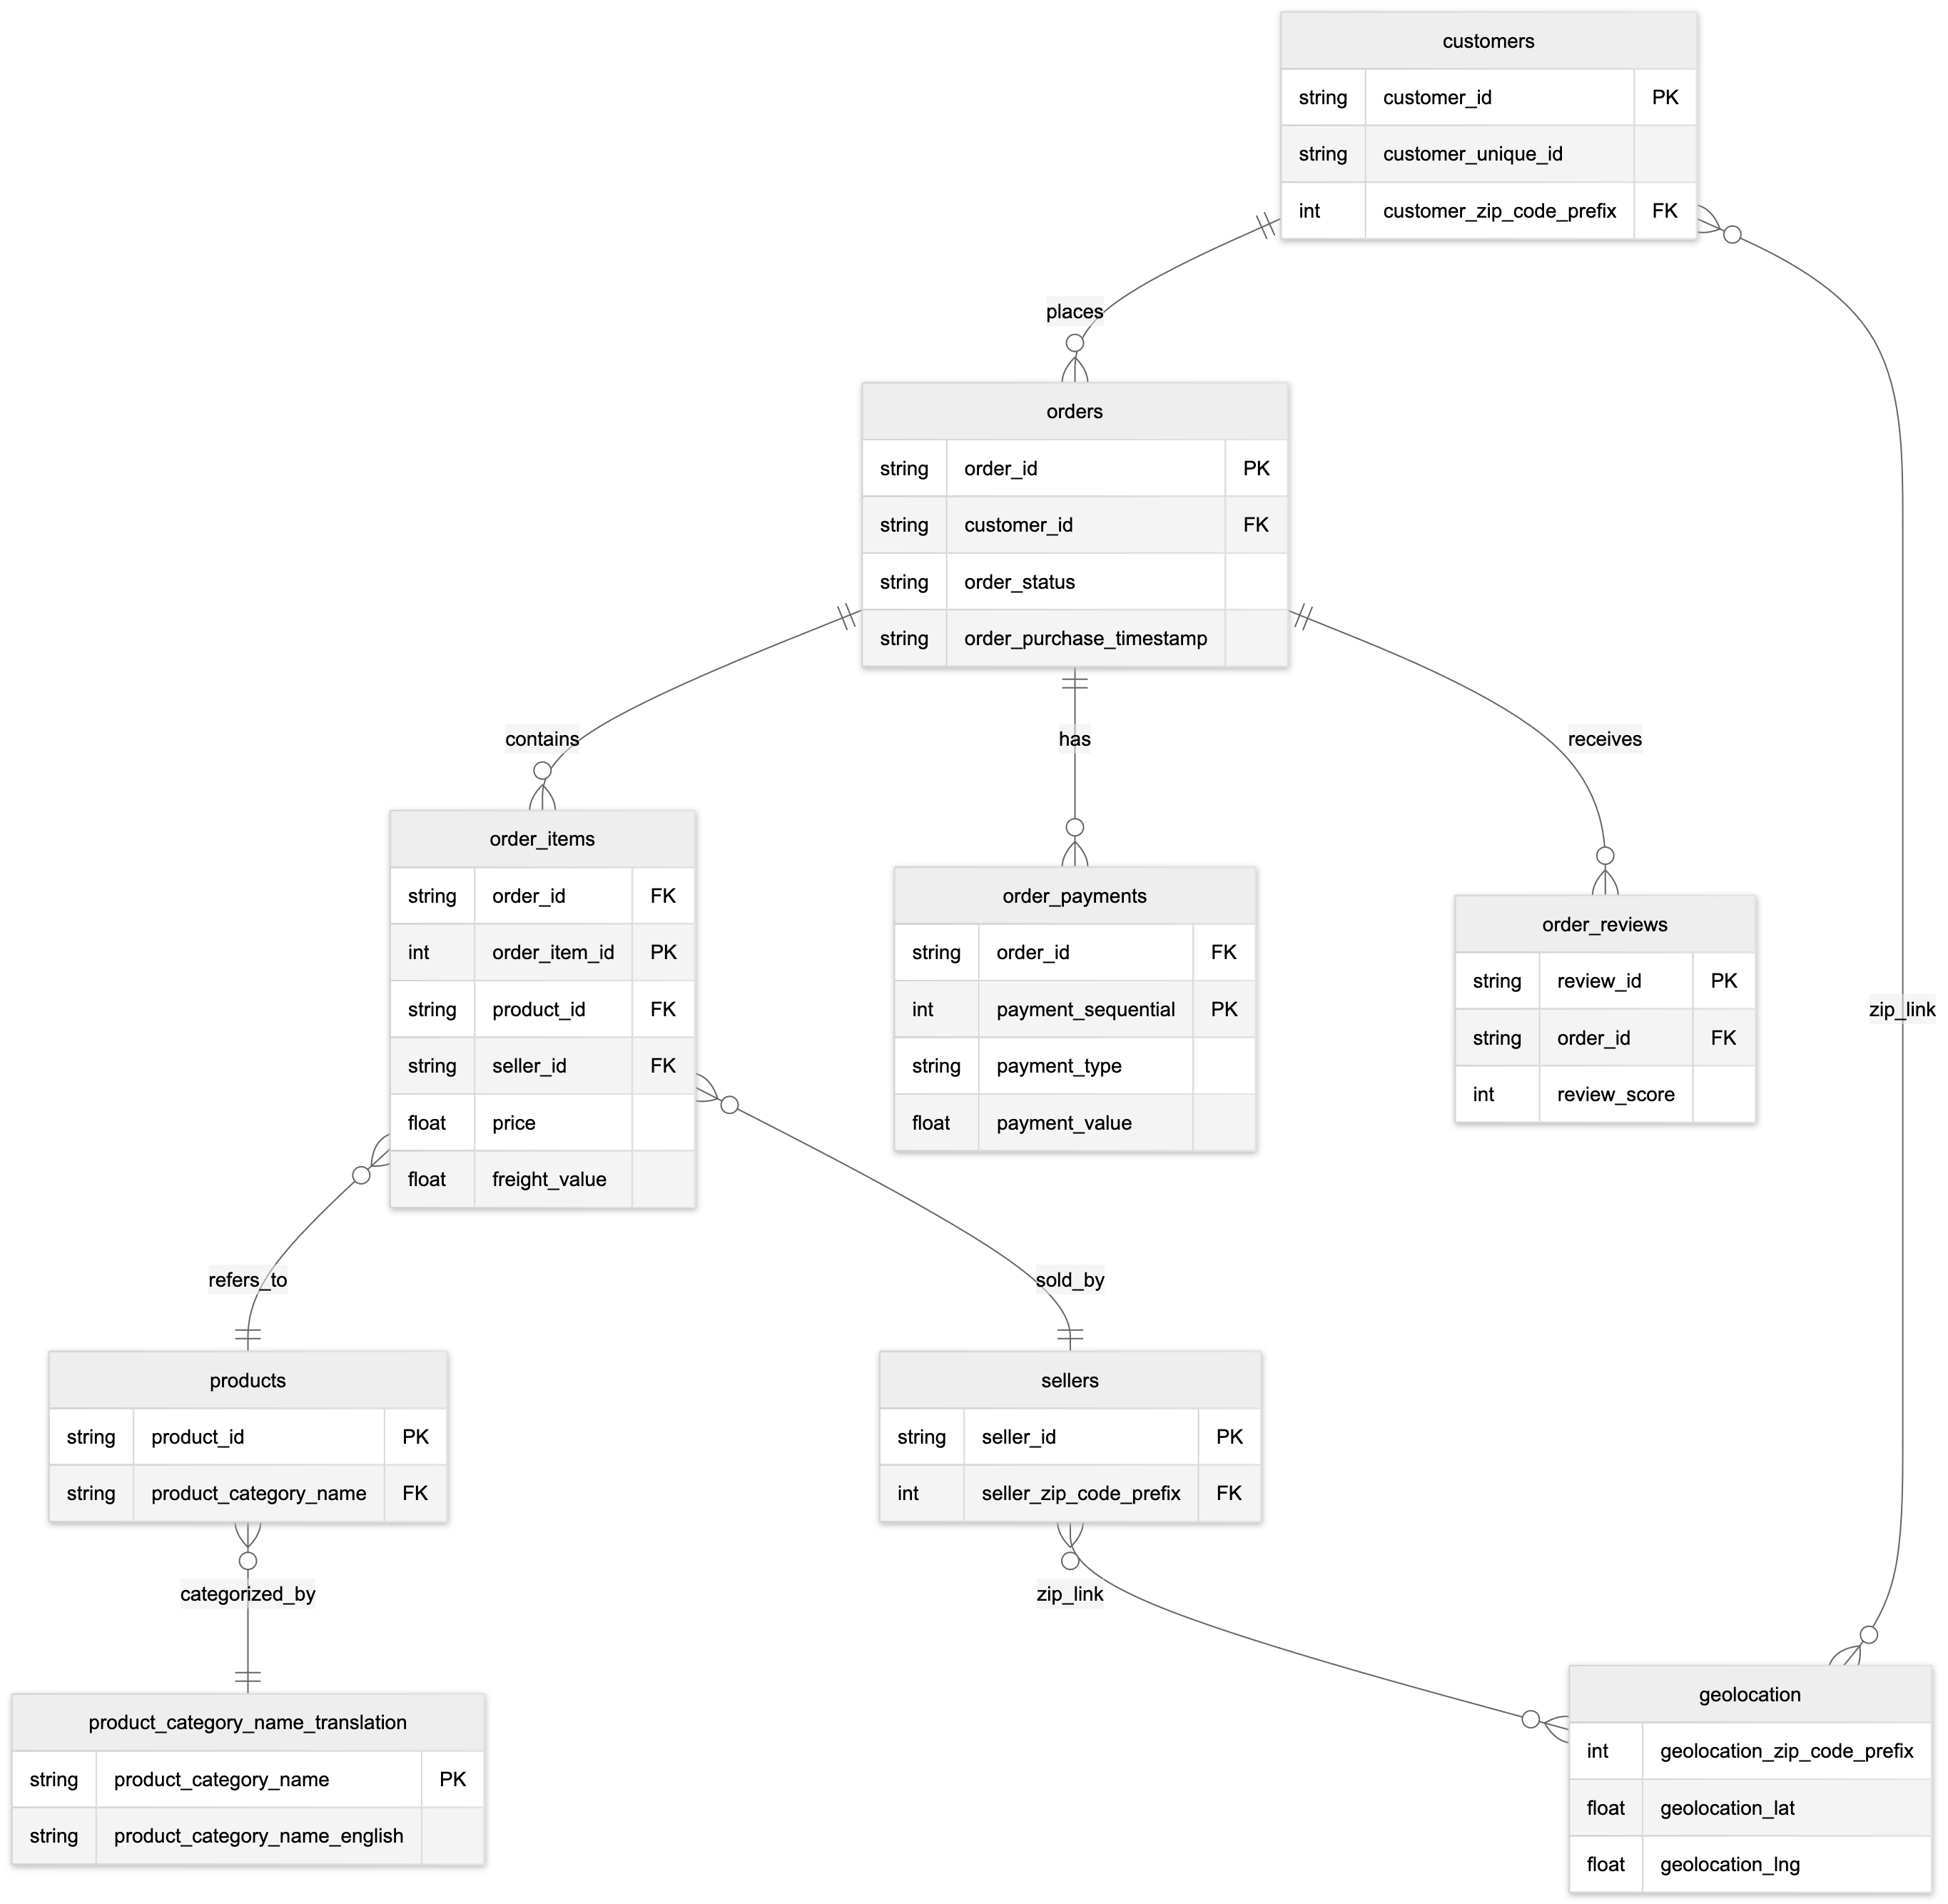
PK: Principal Key; FK Foreign Key.
How It Works
The data pipeline is built on a four-phase approach:
- Ingestion: Data is loaded from 9 interconnected CSV files (Orders, Items, Payments, Reviews, Customers, Sellers, Products, Geolocation, and Translations) to form the initial relational model.
- Preparation: Data is cleaned, standardized, and aggregated to resolve one-to-many relationships (e.g., aggregating multiple payments per order).
- Merging: Strategic Left Joins are used to enrich the core `Orders` table with contextual data (items, payments, reviews, customer info).
- Feature Engineering: Over 40 business-relevant metrics are derived, including RFM scores, delivery logistics features, and seller performance indicators.
The process outputs three complementary Analytical Base Tables (ABTs): at the order, product, and customer level, ready for modeling. .

Engineered Features
The engineered features derives from the initial columns span the following analytical dimensions:
- Temporal Features: Year/month/day/hour extraction, weekend indicators, holiday season flags, approval delays, and carrier pickup times.
- Delivery Performance: Delivery delay calculations, purchase-to-delivery time, delivery status categories (early/on-time/late), and speed classifications.
- Customer Analytics (RFM): Order frequency, recency (days since last order), customer lifetime value, and repeat customer identification.
- Economic Metrics: Average price per item, freight percentage of total, high-value order flags, and customer lifetime value calculations.
- Product & Seller Analytics: Category popularity, seller performance rankings, weight-to-price ratios, premium product identification, and top seller indicators.
Results
The pipeline successfully processed 100,000+ orders across a 2-year period, reducing analytical query complexity by merging 9 tables into 3 purpose-built ABTs. The engineered features enable advanced analytics including RFM customer segmentation, delivery KPI monitoring, seller performance benchmarking, and product catalogue optimization, without requiring complex multi-table joins at query time.